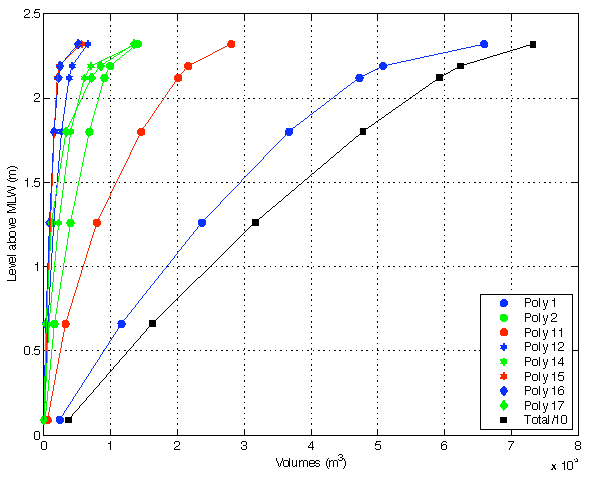
Figure 6: A comparison of tidal prisms for all polygons (Fig. 2). Northern prisms are on the left; southern prisms are on the right. Each curve starts 1 hr after LW (T2), beginning with the volume stored in the first 1-hr interval. The final line-segment in each plot connects water depths and areas from 2.19 to 2.32 meters. The area at 2.19 m references the largest volume calculated for the final image set (T7). The volume at 2.32 m references the total polygon area. Volumes for the total Duplin tidal water shed have been divided by ten to scale that curve with those of the polygons.
Figure 6: Southern prisms
Post date:
Apr 18, 2005