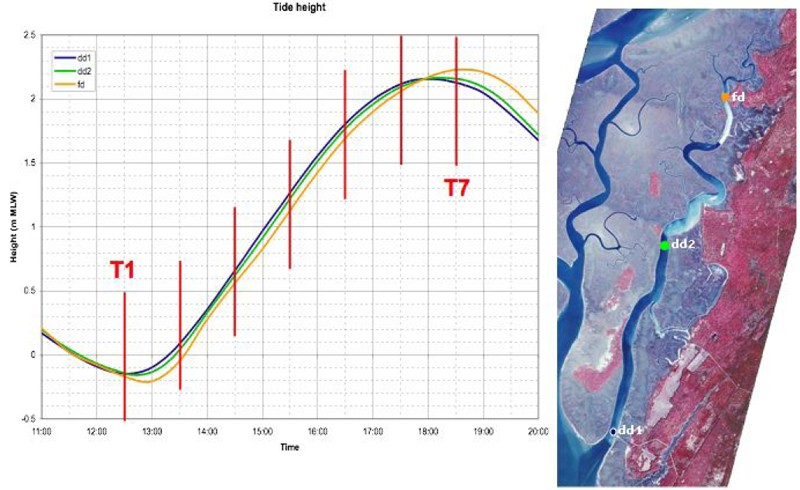
Figure 3: Water level curves for 15 April 2004 at along the axis of the Duplin River.The red vertical lines (T1 through T7) show the times of each aerial pass. The locations of the three curves are shown in the image on the right. Water level at a given time varies within 0.1 m over a distance of ~7 km, so water surface is assumed to be horizontal over the 2-min duration of a single pass of the airplane. Data courtesy of Dr. Daniela Di Iorio and the LTER monitoring network.
Figure 3: Water level curves for 15 April 2004 at along the axis of the Duplin River.
Post date:
Apr 18, 2005