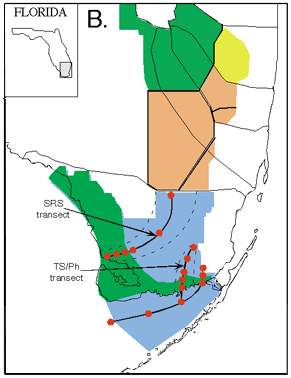
Figure 1: Map of south Florida showing locations of our Everglades transects, with study sites shown as dots (six along the SRS transect and 11 along the TS/Ph transect, including Florida Bay); dark gray indicates freshwater marsh and light gray is mangrove forest.
Figure 1: Map of south Florida showing locations of our Everglades transects, with study sites shown as dots
Post date:
Apr 5, 2000
