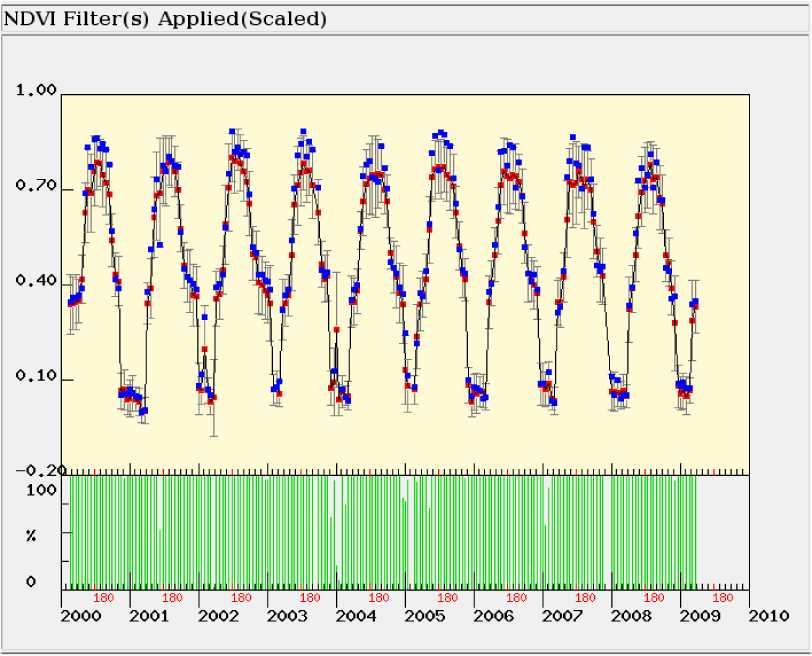
Fig. 3: An example MODIS data subset visualization from 2000 to 2009 of a Normalized Difference Vegetation Index (NDVI) product for the Cedar Creek LTER site. The data include the site center pixel value, the average data value of pixels and standard deviation in a 7 x 7 km grid having valid data and a timeline showing the percentage of pixels in the grid that have acceptable quality.

