Warming Trend Revealed in Global, Long-term Ice Breakup Study
From sources as diverse as newspaper archives, transportation ledgers and cultural traditions, a team of 13 scientists lead by John Magnuson, an investigator at North Temperate Lakes LTER site have amassed lake and river ice records spanning the Northern Hemisphere that show a 150-year warming trend.
The report, which was published in the Sept. 8, 2000 issue of the journal Science, includes 39 records of either freeze dates or breakup dates from 1846 to 1995 and represents one of the largest and longest records of observable climate data ever assembled. And while it is extensive, Magnuson and his colleagues explain that this study only scratches the surface in regard to the ecological effects of global warming.
Going Global
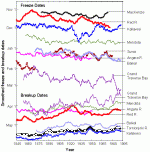
Countries with sites used in the study include Canada, Finland, Russia and Japan. Of those, 37 sites indicate warming. The average rate of change over the 150-year period was 8.6 days later for freeze dates; and 9.5 days earlier for breakup dates. A smaller collection of records going well past 150 years also are in the direction of warming, at a slower rate.
"We think this is a very robust observation: It is clearly getting warmer in the Northern Hemisphere," says Magnuson. "The importance of these records is that they come from very simple, direct human observations, making them very difficult to refute in any general way."
The findings also correspond to an air temperature increase of 1.8 degrees Celsius over the past 150 years. A temperature change of 0.2 degrees Celsius typically translates to a one-day change in ice-on and ice-off dates.
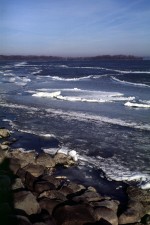
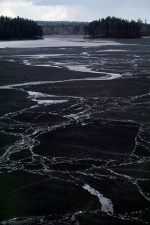
Freeze dates were defined in the study as the observed period the lake or river was completely ice-covered; the breakup date was defined as the last ice breakup observed before the summer open-water phase.
The long-term ice records have valuable attributes for climate researchers, Magnuson says. They can be gathered across a wide range of the globe, and in areas traditionally without weather stations. Their primary weakness is that early observers did not always document the methods used.
Magnuson’s study acknowledges that 10,000 years ago much of the Midwest was covered by ice, "so we know it’s getting warmer," he says. "What’s troubling and scary to people is that these rates in recent decades are so much faster."
Climate models have predicted a doubling of total greenhouse gases in the next 30 years or so, a change that could potentially move the climate boundaries for fish and other organisms northward by about 300 miles, approximately the length of the state of Wisconsin, Magnuson says.
Demonstrating the Value of Networking and Long-term Research
The records in this study are part of a decade-long LTER project led by Magnuson and the UW-Madison Center for Limnology to build a database of lake and river ice records from around the world. "We reached out to colleagues around the world and asked for these records. It turned out some people had very rich stores of data."
The records in this study represent the longest and most intact of 746 records collected through the project. Some individual records are of astonishing lengths, with one dating back to the 9th century, another to the 15th century and two more to the early 1700s.
For example, Lake Suwa in Japan has a record dating back to 1443 that was kept by holy people of the Shinto religion. The religion had shrines on either side of the lake. Ice cover was recorded because of the belief that ice allowed deities on either side of the lake--one male, one female--to get together.
Lake Constance, a large lake on the border of Germany and Switzerland, has a peculiar record dating back to the 9th century. The data were derived from the records of two churches, one in either country, which kept a tradition of carrying a Madonna figure across the lake to the alternate church each year it froze. Two other long records come from Canada’s Red and McKenzie rivers, which date back to the early 1700s and were kept because ice cover and open water were critical to the fur trade. Records from Grand Traverse Bay and Toronto Harbor, both on the shores of the Great Lakes, reflect their prominence as shipping ports.
Other records included in the study are from lakes Mendota, Monona and Geneva from Wisconsin; lakes Detroit and Minnetonka from Minnesota; lakes Oneida from New York and Moosehead from Maine; Lake Kallavesi from Finland; and the Angara River and Lake Baikal from eastern Russia.
Another finding in the study, based on the 184 ice records from 1950 to 1995 (View table 1), showed the variability in freeze and breakup dates increased in the last three decades. Magnuson says it might be related to intensification of global climate drivers such as the El Nino /La Nina effects in the Pacific Ocean.
Future Challenges
While the data are extensive, there is still much research to be done. Magnuson says the observational nature of the study is "both its strength and its weakness," and the results do not offer specific proof that greenhouse gases are driving the warming trend. However, the findings are consistent with computer-generated models that have been developed to estimate climate change from greenhouse gases over a 125-year time period, he says.
Magnuson says future studies might include examining inter-annual variability and how it has fluctuated over the same 150 years. "We’d like to be able to explain the variation that occurs through the 150 years owing to changes in the north Atlantic oscillation, the north Pacific oscillation, the Southern Ocean oscillation, and perhaps changes in the suns’ activity. We’d also like to test alternative models than a straight line to fitting the data."
And I would be very interested in seeking out other long-term data sets on lakes and rivers and see if there are other long-term data--longer than the LTER programs record, 50 years and longer."
Magnuson and colleagues conclude that the explanation of the long-term trend is significant. "Such questions should be addressed and are being addressed through activities of many other scientists and are being synthesized through the activities of the Intergovernmental Panel on Climate Change in their pending 2000 assessment."
Finding funding for such projects always presents a challenge. "NSF provided an opportunity about five years ago for such synthesis of long-term records possible," Magnuson says, "but future funding is always uncertain for international multiple-site and multi-country analyses."
Above all, Magnuson acknowledges that it is only through significant cooperation among international colleagues that this type of study is possible, including in this study:
D.M. Livingstone (Switzerland); T. Arai (Japan); V. Kuusisto (Finland); N.G. Granin and V.S. Vuglinski (Russia); T.D. Prowse (Canada); D.M. Robertson, R.H. Wynne, B.J. Benson, K.M., Stewart, R.A. Assel, R.G. Barry, and E. Card, (U.S.).
Table 1. Linear trends in freeze and breakup dates for lakes and rivers with more than 100 years of data from 1846 to 1995. All sites are lakes unless specified. Trends are based on all available data for the 150 year period. Location and p values (significance) of trend are provided.
1 Sites listed in bold in this column are illustrated in Figure 1 (left). Several values in this table have been corrected since original publication in Science; 2000, Historical Trends in Lake and River Ice Cover in the northern Hemisphere, Vol. 289, No. 5485. p. 1743-1746.
|
|
Freeze Date |
Breakup Date |
|||||||
|
ID # Site |
Location |
Number of Years |
Years |
Trend (Later) |
P value |
Number of Years |
Years |
Trend (Earlier) |
P value |
| North America | |||||||||
|
1 MacKenzie River |
Canada |
105 |
1868-19911 |
6.1 |
0.007 |
|
|||
|
2 Red River |
Canada |
162 |
1799-1981 |
13.2 |
<0.001 |
180 |
1799-19931 |
10.6 |
<0.001 |
|
3 Detroit River |
U.S., Minn. |
101 |
1892-1994 |
12.9 |
0.003 |
||||
|
4 Osakis |
U.S., Minn. |
|
121 |
1866-1989 |
4.3 |
0.086 |
|||
|
5 Minnetonka |
U.S., Minn |
112 |
1854-1989 |
2.0 |
0.444 |
||||
|
6 Mendota |
U.S., Wisc. |
141 |
1853-1995 |
6.0 |
0.008 |
142 |
1852-1995 |
7.5 |
0.001 |
|
7 Monona |
U.S., Wisc. |
143 |
1851-1995 |
7.2 |
0.008 |
142 |
1851-1995 |
12.2 |
<0.001 |
|
8 Rock |
U.S., Wisc. |
107 |
1886-1992 |
1.9 |
0.544 |
||||
|
9 Geneva |
U.S., Wisc. |
134 |
1862-1995 |
2.3 |
0.511 |
||||
|
10 Grand Traverse Bay |
U.S., Mich. |
146 |
1850-1995 |
11.4 |
0.006 |
146 |
1850-1995 |
11.8 |
0.004 |
|
11 Toronto Harbor |
Canada |
111 |
1822-1985 |
36.9 |
<0.001 |
111 |
1822-1985 |
7.4 |
0.213 |
|
12 Oneida |
U.S., NY |
151 |
1845-1995 |
0.2 |
0.930 |
||||
|
13 Otsego |
U.S., NY |
147 |
1849-1995 |
4.8 |
0.087 |
154 |
1842-1995 |
6.5 |
0.004 |
|
14 Schroon |
U.S., NY |
107 |
1872-1995 |
5.6 |
0.014 |
||||
|
15 Cazenovia |
U.S., NY |
101 |
1844-1995 |
3.6 |
0.057 |
113 |
1838-1995 |
4.0 |
0.125 |
|
16 Moosehead |
U.S., Maine |
149 |
1847-1995 |
5.6 |
<0.001 |
||||
|
17 Miramichi River |
Canada |
127 |
1829-1955 |
7.3 |
0.002 |
||||
|
|
Europe |
|
|||||||
|
18 Tornionjoki River |
Finland |
304 |
1692-1995 |
6.6 |
<0.001 |
||||
|
19 Vesijarvi |
Finland |
104 |
1885-1995 |
0.7 |
0.874 |
110 |
1870-1995 |
7.1 |
0.005 |
|
20 Paijanne |
Finland | 104 |
1885-1995 |
1.9 |
0.697 |
108 |
1870-1995 |
8.3 |
0.002 |
|
21 Kallavesi |
Finland |
161 |
1833-1995 |
5.3 |
0.038 |
163 |
1833-1995 |
9.2 |
<0.001 |
|
22 Nasijarvi |
Finland |
160 |
1836-1995 |
5.7 |
0.055 |
161 |
1835-1995 |
8.8 |
<0.001 |
|
23 Lej da San Murezzan |
Switzerland |
164 |
1831-1994 |
8.1 |
<0.001 |
||||
| Asia | |||||||||
|
24 Angara River |
Russia |
236 |
1720-1955 |
7.6 |
0.019 |
236 |
1721-1956 |
-2.1 |
0.465 |
|
25 Baikal |
Russia |
128 |
1868-1995 |
11.0 |
<0.001 |
128 |
1868-1995 |
5.1 |
0.004 |
|
26 Suwa |
Japan |
415 |
1443-1993 |
-4.5 |
0.247 |
||||
 Enlarge this image