A Study of the Middle Rio Grande Basin
The need for accurate water budgets for rivers in arid and semi-arid regions of the world is growing due to ever increasing human demand for fresh water that leads to inevitable conflicts between the use of water for human needs and requirements for water by native ecosystems. The interplay between water availability and water demand has placed most arid land rivers and riparian zones in peril. The Middle Rio Grande of central New Mexico, a rapidly growing region of the United States where over half the population of the State of New Mexico presently resides, is an increasingly endangered river/riparian ecosystem. Drought threatens the very existence of surface water in this overextended and endangered ecosystem. Research at the Sevilleta LTER and other sites along the Middle Rio Grande is attempting to improve our knowledge of water depletions from river and riparian ecosystems. Here, we highlight results of a recent water budget for this reach of river and describe ongoing research on measuring annual growing season evapotranspiration (ET) rates from native and non-native riparian gallery forest or bosque.
The Middle Rio Grande of New Mexico is defined as the river reach between Otowi Gage just north of Santa Fe and Elephant Butte Dam at Truth or Consequences, a distance of about 320 kilometers (Figure 1). The Middle Rio Grande constitutes about 10% of the total length of the Rio Grande. The existing riparian gallery forest is now spatially limited by a system of levees and natural bluffs. Historically, the Middle Rio Grande was a flood-dominated ecosystem in which spring snowmelt from the mountains of southern Colorado and northern New Mexico produced peak discharge between mid-May and mid-June. Overbank flooding was once an integral component of the riparian forest ecosystem and the riparian zone was a complex mosaic of vegetation types including cottonwood (Populus deltoides ssp. wislizenii), Goodding willow (Salix gooddingii), wet meadows, marshes, and ponds. However, water management policies during this century have greatly altered many aspects of the floodplain ecosystem, and dam construction and river channelization have prevented annual spring flooding in recent decades. These conditions are exacerbated during dry years. Most of the remaining cottonwood gallery forest in the Middle Rio Grande reflects a legacy of flooding that occurred over half a century ago. Structural changes in the riparian vegetation have been rapid and well documented. For example, half of the wetlands in the Middle Rio Grande have been lost in just 50 years (Crawford et al. 1993). Cottonwood germination, which requires scoured sandbars and adequate moisture from high river flows, has declined substantially. Meanwhile, invasion by exotic phreatophytic plants such as salt cedar (Tamarix ramosissima) and Russian olive (Elaeagnus angustifolia) has greatly altered the species composition of the riparian forests within the valley. Native cottonwood stands are in decline. For example, the cottonwood-dominated bosque in Albuquerque has experienced a 40% decline in cottonwood leaf litterfall over the past decade (Molles et al. 1998).
A recent water budget developed for the Middle Rio Grande reflects these changes to river and bosque. An annual water budget for the Middle Rio Grande for the 26-year period from 1972-1997 has been produced (Middle Rio Grande Water Assembly 1999) to assist with water management decisions. It provides annual averages in units of acre-feet per year (af/y) for nearly all inflows, outflows, and changes in water storage. Natural variability is high for almost all of the numerical estimates in the budget, and uncertainties in the various estimates also are commonly large. The Otowi gage is the inflow point for the Middle Rio Grande reach. Flow records go back more than 100 years at this gage. Outflow is determined by discharge from Elephant Butte Reservoir. Major sources of water depletion within the Middle Rio Grande include
- Urban consumption
- Irrigated agriculture
- Aquifer recharge,
- Open-water evaporation
- Riparian plant transpiration
Many of these depletions vary substantially year-to-year and estimates for many of these terms come with very large measurement uncertainties. Best present estimates, however, suggest that on average the largest depletion term constituting about one-third of the total annual depletion comes from open-water evaporation (~220,000 af/y) with direct evaporation from reservoirs the largest single depletion loss. The second largest depletion term, estimated to average about one-quarter of total annual depletion (~180,000 af/y), is riparian plant or bosque transpiration (annual estimates from 110,000-275,000 af/y). Considerable uncertainty presently exists regarding these estimates. For example, potential differences in annual transpiration rates between native and non-native riparian plant species are unknown, and effects of fluctuations in river discharge due to drought or flooding on transpiration rates have not been measured in the basin. Irrigated agriculture is estimated to account for approximately 20% of annual average depletions in the Middle Rio Grande (~135,000 af/y) with urban consumption and net aquifer recharge estimated to be of comparable magnitude and accounting for the 20-25% of the remaining estimated total annual depletion in the Middle Rio Grande.
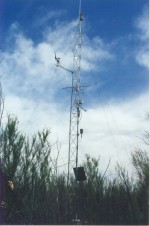
We have established eight research sites with support from NASA along the Middle Rio Grande to better determine annual rates of bosque ET (Figure 1). Four sites are in stands dominated by exotic salt cedar and four sites are in stands dominated by native cottonwood. Occasional flooding occurs in two of the salt cedar and two of the cottonwood stands and does not occur in the other four stands. Two of the stands with salt cedar have 10 m towers (Figure 2) and two of the cottonwood stands have 25 m towers equipped with three-dimensional eddy covariance flux instrumentation to estimate water vapor fluxes. Eddies are characterized above the forest canopy by fast-response instruments that measure wind speed in three dimensions as well as vapor pressure. The covariance between vertical wind speed and vapor pressure is used to determine the flux of latent heat from the forest, which is converted to rate of ET using the density and latent heat of vaporization for water. The 2000 growing season will be the first year with data from all four towers while data in 1999 were gathered at the two salt cedar sites only.
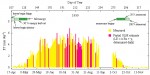
ET rates for salt cedar at the Sevilleta LTER site are shown in Figure 3. Onset of ET occurred in the middle of April. Peak rates of ET of approximately 6 mm per day occurred in July. Daily rates of ET were well correlated with atmospheric humidity with lower ET occurring on more humid days. Measurable ET ceased on October 17 after a strong freeze. Integration of ET rates throughout the growing season at this site yielded a value of 57 cm. A second site at Bosque del Apache had an annual ET rate of 99 cm. This site floods regularly and contains a much denser stand of salt cedar.
Work in progress will use remote sensing techniques to more accurately classify the bosque vegetation and scale the stand estimates from the native and non-native sites to produce estimates of ET for the entire bosque of the Middle Rio Grande. Long-term measurements over multiple growing seasons will allow better estimates of interannual variability and address the effect of flooding on the amount of water used by various types of native and non-native vegetation. Data to date confirm high rates of water use by dense thickets of non-native vegetation and the importance of introduced species as a large source of water depletion for the Middle Rio Grande.
References
Crawford, C.S., A.C. Culley, R. Leutheuser, M.S. Sifuentes, L.H. White, and J.P. Wilber. 1993. Middle Rio Grande Ecosystem: Bosque Biological Management Plan. U.S. Fish and Wildlife Service, District 2, Albuquerque, New Mexico, 291 pages.
Middle Rio Grande Water Assembly. 1999. Middle Rio Grande water budget (where water comes from, and goes, and how much): averages for 1972-1997. Middle Rio Grande Council of Governments of New Mexico. 10 pages.
Molles Jr., M.C., C.S. Crawford, L.M. Ellis, H.M. Valett, and C.N. Dahm. 1998. Managed flooding for riparian ecosystem restoration. BioScience 48:749-756.
 Enlarge this image