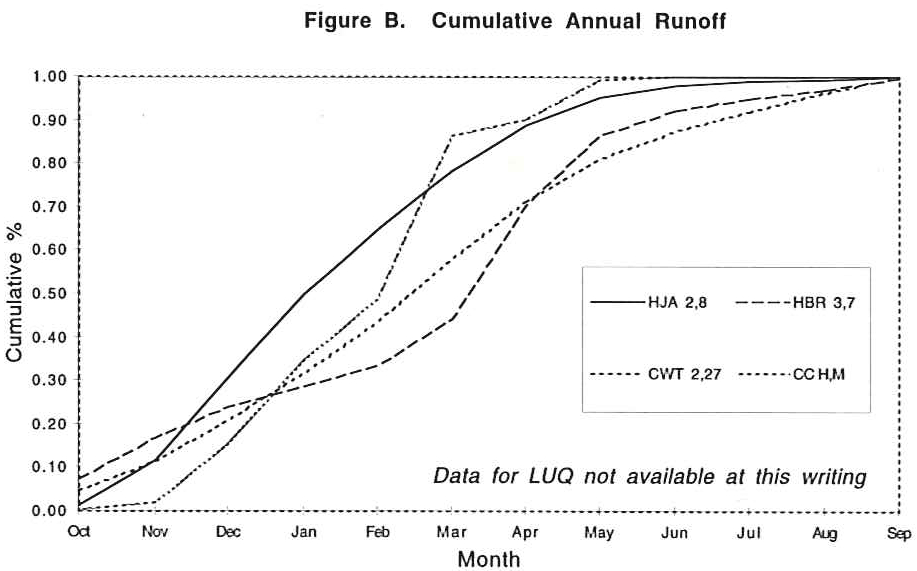
Figure B. Cumulative annual runoff of AND, HBR, CWT, and CC. Percentages represent averaged percentages of runoff produced at two control watersheds at each site.
Figure B. Cumulative annual runoff of AND, HBR, CWT, and CC.
Post date:
Apr 18, 1996

Figure B. Cumulative annual runoff of AND, HBR, CWT, and CC. Percentages represent averaged percentages of runoff produced at two control watersheds at each site.
