Fig. 1. February 2009 and 2010 Landsat TM imagery (bands 5, 4, & 3) of Shark River, Everglades National Park, depicting changes in the spectral reflectance of mangroves and marshes as a result of the January 2010 freeze.
February 2009 and 2010 Landsat TM imagery (bands 5, 4, & 3) of Shark River, Everglades National Park
Post date:
Jul 5, 2010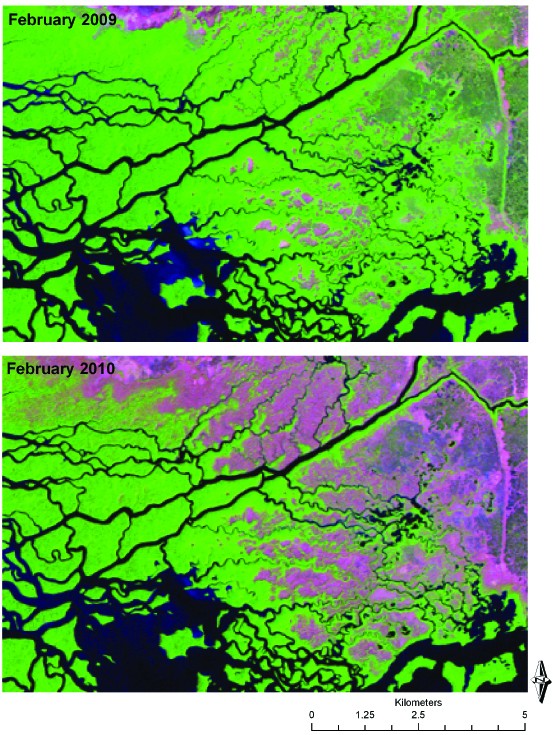
Photo courtesy of:
J.S. Rehage