Interactive Web site offers virtual tour for armchair ecologists
Long-term analysis of vegetation data is fundamental to the LTER program. However, vegetation monitoring produces tremendous amounts of data that are difficult to summarize. At HBR we were faced with 38 years of accumulated long-term forest plot monitoring data becoming buried and inaccessible in the lab (and in the database on the web!!). Over the last two years, we have made significant progress in making these data more of a living tool, converting what was static into something dynamic and useful. The result is several PERL-based programs that allow the web user to summarize and graph the forest plot data from several Hubbard Brook study areas in a variety of ways--all of them online and on the fly!
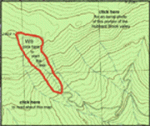
Datasets utilized in this effort include inventories spanning almost 40 years for Hubbard Brook’s biogeochemical reference watershed (Watershed 6), 20 years for a clearcut watershed (Watershed 5), and 5 years for a watershed (Watershed 1) treated with calcium (see the LTER Network Newsletter online, Spring 2000, page 2). Also included are 20 years of data in a lower elevation tagged-tree study area, and a mid-1990s inventory that encompasses the entire Hubbard Brook valley. Forest communities include the northern hardwood forest (largely beech, sugar maple and yellow birch) and the boreal transition forest (dominated by spruce, fir and white birch). As of July 2003, we have the following interactive programs operating:
- A single tree biomass/chemistry program allows the user to choose a species, elevation, and bole diameter. The program returns the estimated biomass of that tree, by plant part, using allometric equations developed at Hubbard Brook. The elemental content for several elements by plant part is also output from this program, as well as the number of leaves and the leaf area. There is also an option to "grow the tree" by decreasing or increasing its diameter and or height to compare the "real" biomass with projected biomass.
- A phytosociology program uses tree census data dating back to 1965 to calculate basal area, density and frequency by species for diameter and health (or "vigor") classes selected by the user. These summaries can also be made by any number of combinations of plots as well as selected elevation bands. Graphs are made "on the fly" for speciesspecific basal area and density, basal area by elevation, and species-specific stem diameter distributions.
- A "landscape" biomass program returns biomass estimates by species for the same sets of data used in the phytosociology program. This is presently only operational for the biogeochemical reference watershed forest (Watershed 6). This program also calculates the forest productivity for 1997 -- the only recent period for which we have extensive annual diameter-based growth functions for all the species and subdivided by elevation. (Although older productivity estimates were available for 1965, considerable changes have occurred since that time). The recent efforts toward forest productivity estimates at Hubbard Brook were started several years ago in response to an LTER request for such data. At the time we did not have this level of detail at HBR, but now it is available online and productivity can be estimated for a wide variety of species and elevations.
- A mortality/in-growth program allows the user to track the in-growth and death of individual trees through 12 years (1991 - 2003) within one of our study areas. The program also follows the rate at which dead trees become snags, the rate at which dead trees and snags fall to the ground, and other possible combinations of fates. This study includes about 6000 tagged trees and was developed in response to a 1989 LTER "mortality" workshop where it was suggested that HBR establish such an inventory in order to follow individual stems over long periods of time to get mortality rate estimates.
All of these programs can be accessed at the following URL: http://www.hubbardbrook.org/yale/watersheds/w6/index.html
We are constantly learning how to use new programming tools and these websites are a work in progress. The next leap we hope to make is to be able to spatially map the data in a colored GIS-type map and from there, who knows!
 Enlarge this image