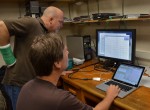
When the plants and microbes exhale on the 1,700-acre W. K. Kellogg Biological Station’s hundreds of plots, Sven Bohm, Kevin Kahmark and a team of fellow researchers sniff their breath.
Not literally, of course.
Rather, using the latest and fastest instruments and software -- much of it based on their own ingenuity -- the team continually samples and analyzes gases produced by the multitude of plants and soil organisms in different parts of the agricultural landscape as part of a long-term study of how agricultural practices affect the production of greenhouse gases.
"The final outcome," Bohm said, "is to help policy makers and others make good decisions."
Bohm, information manager, and Kahmark, research scientist, are responsible for keeping the automated lab and field instrumentation up and running for the researchers who analyze the data and write papers for scientific journals.
Gases released by crops, trees, native plants, and soil microbes have been sampled at the Kellogg Biological Station (KBS) for more than two decades. But thanks to two innovative systems created by Kahmark and colleagues -- one in the field and one in the lab -- and new computer coding from Bohm, the number of samples that can be sampled and analyzed on any given day has been increased 10 fold. The result is a far clearer picture of the continually changing flow of gasses triggered by a myriad of factors, such as rainfall, temperature, fertilization techniques and time of year.
"Over time," Bohm said, "the large amount of data gives us a clearer long-term picture."
KBS, located in southwest Michigan, maintains crop and dairy farms whose research programs focus on agricultural production. Its Long-term Ecological Research (LTER) program studies the ecology of intensive agricultural ecosystems, including annual crops such as corn, soybeans and wheat, perennial crops such as alfalfa, and biofuel crops such as switchgrass and poplars.
Agriculture is a significant source of the greenhouse gasses carbon dioxide (CO2), nitrous oxide (N2O) and methane, Kahmark said. While carbon dioxide is the best known of the greenhouse gasses, N2O is more than 300 times more potent than carbon dioxide as a greenhouse gas, he said. Methane, too, is more potent than CO2, although both N2O and methane are far less concentrated in the atmosphere.
"Agriculture accounts for 60 percent to 70 percent of N2O emissions from human activity," Kahmark said, while livestock is a significant source of atmospheric methane.
"Sampling helps us understand how agricultural management affects greenhouse gas production," Bohm said. "That way producers can choose management practices that minimize greenhouse gas production while maximizing production."
Kahmark said that rainfall and fertilizer application influence the production of N2O and that their research provides the KBS scientists with data needed to show farmers "the potential of backing off fertilizer use to reduce N2O while maintaining crop yields."
The KBS LTER team monitors the greenhouse gas emissions both manually and automatically. In some cases, the researchers place small, covered metal canisters over a selected spot and collect emissions over an hour, Kahmark said. Trapped gasses are captured and injected into vials that are taken to the lab where Kahmark’s machine analyzes the gas samples. This lab system is the first of its kind in the world. What makes it unique is the way in which it analyzes all three GHG simultaneously and the capacity it has to analyze hundreds of samples per day.
Equally remarkable is the automatic gas collection system in the field. Numerous boxes are placed on the soil in fields under different management. Several times a day they close automatically, collect air samples which are sent to small field labs where samples are automatically analyzed. The results are sent wirelessly to Bohm and Kahmark.
The amount of data flowing into the lab is enormous -- thousands of samples every week -- and that's where Bohm's computer code screens the millions of data points and produces a spreadsheet of every sample for each chamber that can be easily interpreted by Kahmark and others.
This field greenhouse gas collection system is one of only a few of its kind in the world.
"Many researchers elsewhere do their sampling and analysis by hand," Kahmark said. "There's no way we could do that at the resolution we need for understanding daily gas fluxes ,” he said, noting that the goal of maximizing production while reducing greenhouse gasses “is a win-win situation."

 Enlarge this image
