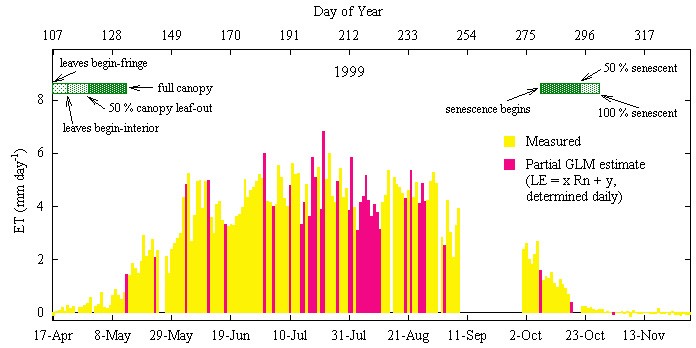
Figure 3. Evapotranspiration (ET) rates in a riparian salt cedar stand during 1999 at the Sevilleta LTER site, New Mexico.
Figure 3. Evapotranspiration (ET) rates in a riparian salt cedar stand during 1999 at the Sevilleta LTER site, New Mexico.
Post date:
Nov 4, 2000