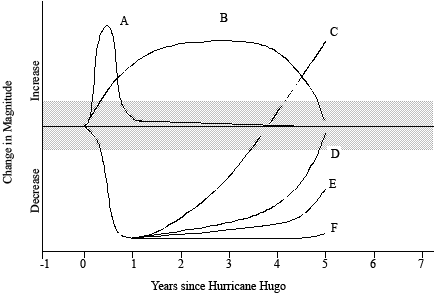
Figure 1. Idealized 5 yr trajectories of responses of different variables in the LUQ site, Puerto Rico, to disturbance caused by Hurricane Hugo. The shaded portion of the graph represents +/- 15 percent variation indistinguishable from pre-hurricane values. Curve A: transient (<1 yr) increase. Examples include forest floor biomass, some soil nutrient pools, and nitrate concentrations in streams. Curve B: slow increase and return to pre-hurricane levels. Examples are net primary productivity, abundance of Atya shrimp in streams, of adult coqui frogs, and of the terrestrial snail, Cepolis squamosa. Curve C: catastrophic decrease and subsequent rise above pre-hurricane levels. Examples are aboveground pools of potassium and magnesium and of several species of terrestrial snails. Curve D: catastrophic decrease and return to near pre-hurricane levels. Examples are tree biomass and tree density. Curve E: a catastrophic decline and steady increase, but not to within 15 percent of pre-hurricane levels. An example is fine total litterfall. Curve F: catastrophic decline and little recovery until 5 yr post-hurricane. Examples are fine root biomass and abundance of the walking stick, Lamponius portoricensis. Both of the latter returned to near normal values subsequently.
Figure 1.
Post date:
Nov 23, 2005
